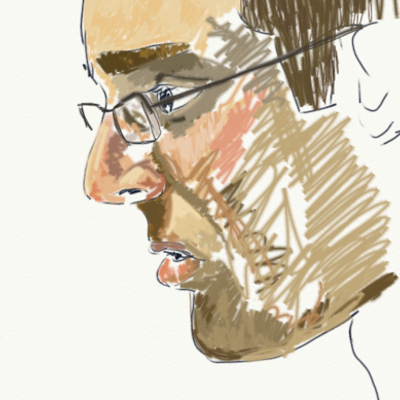
![Popover from Instruments after running the Processor Trace tool.
[Error]
Timestamp: (Before Run Started)
Message: Failed to stop recording session: Data Providers emitted errors: CPUTrace](https://federated.saagarjha.com/media/3f2b3e4a-f80c-402f-a740-491911b47f53/file.png "Popover from Instruments after running the Processor Trace tool.
[Error]
Timestamp: (Before Run Started)
Message: Failed to stop recording session: Data Providers emitted errors: CPUTrace")
Saagar Jha
(replying to Saagar Jha)
lmao, ok. I guess this literally refuses to work if you don’t give the traced process get-task-allow which is definitely one of the choices of all time
I guess we can just let the https://developer.apple.com/forums/thread/776577 guy be confused why it doesn’t work or we can fix this: FB17150847
I guess we can just let the https://developer.apple.com/forums/thread/776577 guy be confused why it doesn’t work or we can fix this: FB17150847

Saagar Jha
(replying to Saagar Jha)
The process, of course, gets traced anyway because it don't care what the kernel thinks is impossible.
https://github.com/saagarjha/dotfiles/blob/master/fix_processor_trace.c
https://github.com/saagarjha/dotfiles/blob/master/fix_processor_trace.c


Saagar Jha
(replying to Saagar Jha)
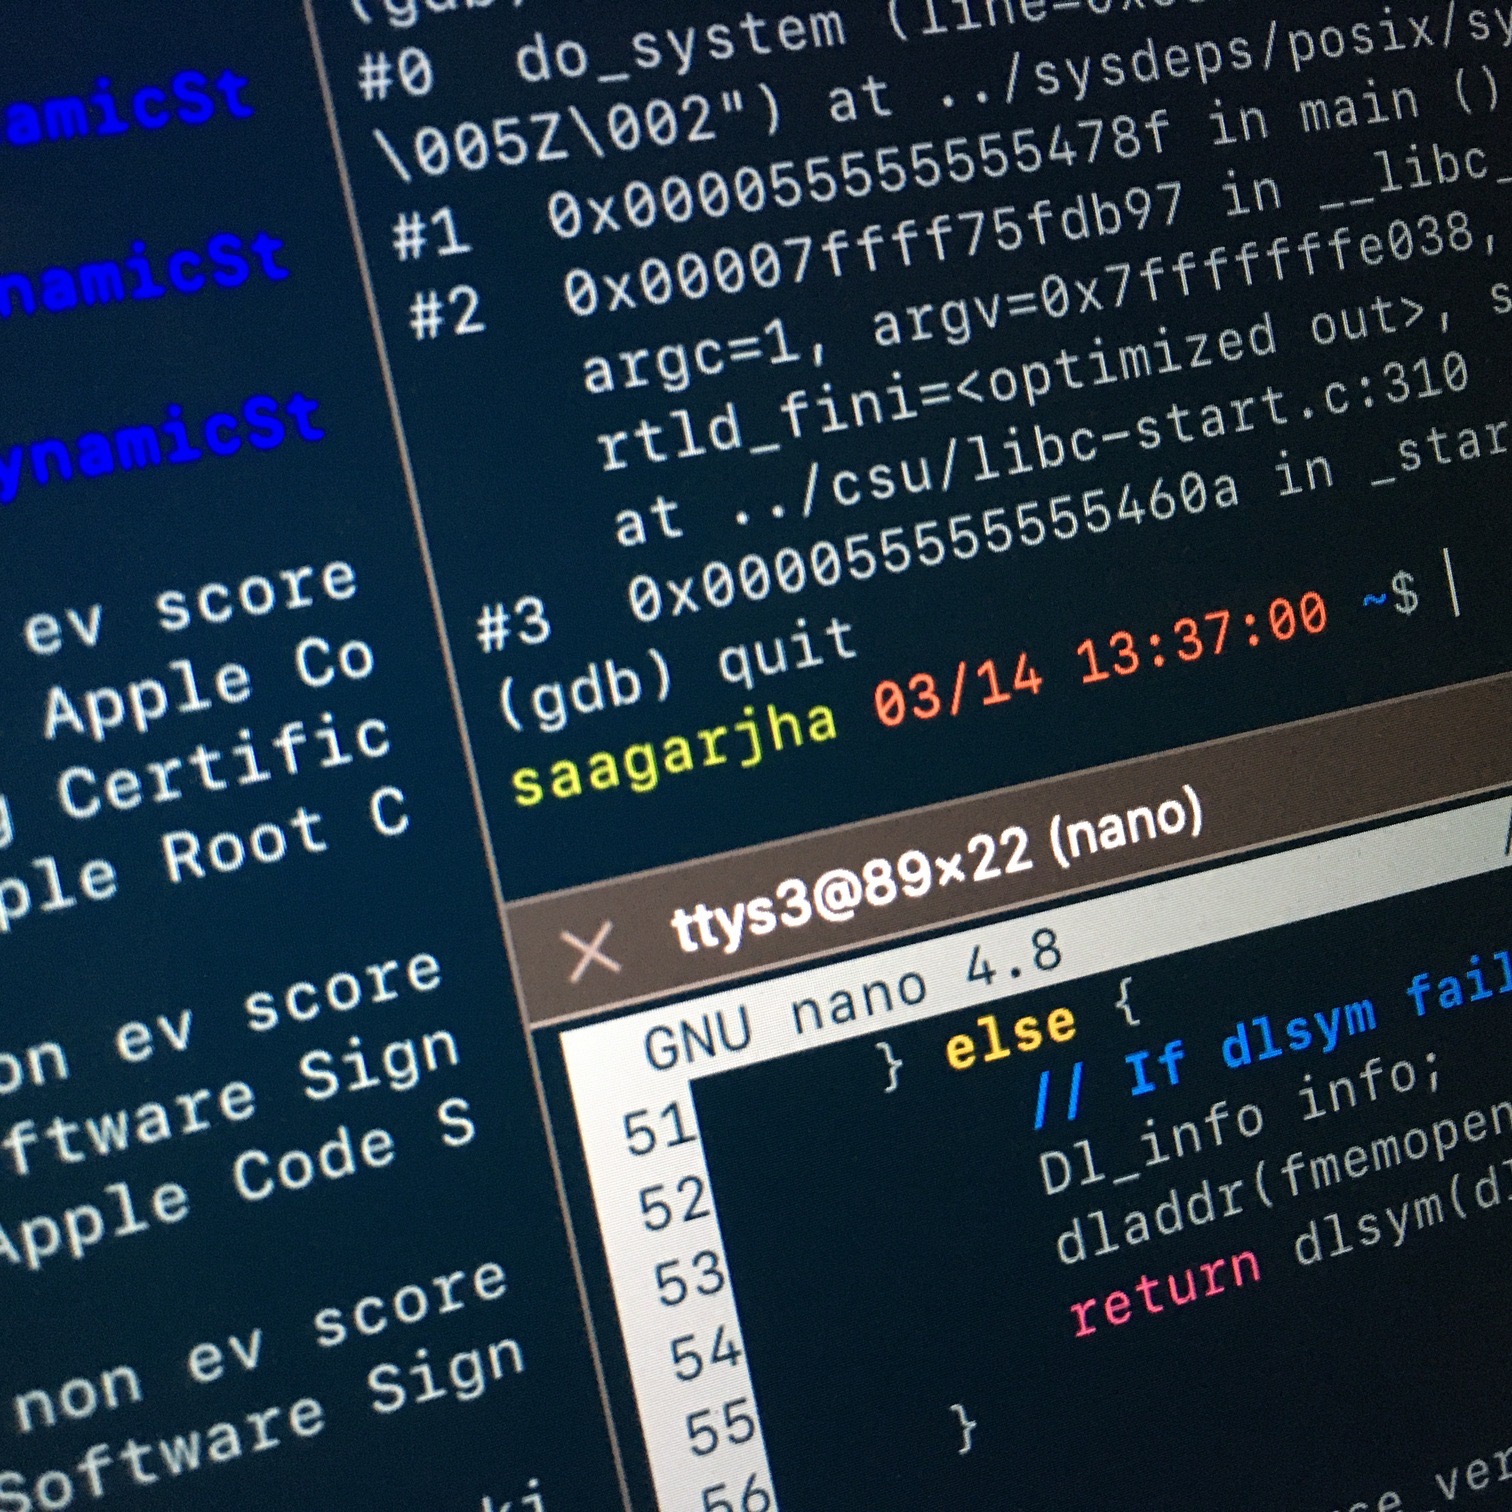
CPU traces can be very large so Instruments helpfully provides an option asking you how much storage space you want to spare. For this 5 second trace I told it to use 10 GB. So far it has used 300 GB and it’s showing no signs of stopping (FB17151084)

. The cursor is hovering over one track, actually one stack frame, showing that it is “specialized Array.init(_unsafeUninitializedCapacity:initializingWith:) (8.00ms)”")


Saagar Jha
(replying to Saagar Jha)
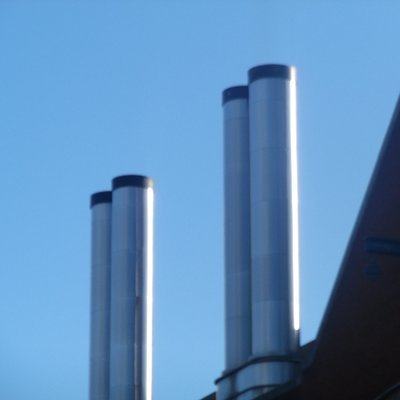
Ever wondered system libraries have initializers? How about which ones are the most expensive? Which one is the first to touch the Objective-C runtime? Well here’s your answer in a single image
, libdispatch_init, _libxpc_initializer in that order")


Saagar Jha
(replying to Saagar Jha)
Anyway I have actual work to do so I’ll play with this later. It’s very rough but also very cool and I expect it to be invaluable for any serious performance or debugging work. I hope to see it continue to improve :)
Saagar Jha
(replying to Saagar Jha)
Also, fair warning: the entire process to generate the screenshots above created about 4 TB of disk traffic. Hopefully you have AppleCare